Issue, No.30 (June 2024)
Educational Expansion and Returns to Higher Education in Austria over three Decades
Since December 2021, LIS has also extended its annualisation strategy to Austria, currently covering the period from 1994 to 2021.2 This makes it possible to gain insights into long-term trends in social outcomes, to study cohort dynamics, and to estimate the impact of policies.
The Austrian context
Austria is considered a coordinated market economy (Hall and Soskice, 2001) and part of the conservative welfare state regime (Esping-Andersen, 1990). As such, it is characterised by a high degree of coordination in wage bargaining at the sectoral level (Delahaie et al., 2015) and a relatively high degree of redistribution through the tax and transfer system (Rocha-Akis et al., 2016). With a Gini coefficient of 0.28 in 2021, inequality in disposable household income is low compared to other high-income countries. However, inequality in market income remains high: the Gini coefficient for gross wages is equal to 0.42 in 2021, which is higher than in Germany or the UK.3 The Austrian benefit system provides adequate support for low-income households so that the poverty rate is among the lowest in the OECD (Förster and Königs, 2020). However, family policies tend to promote the traditional one-earner or one-and-a-half-earner model, contributing to persistently high gender inequalities in hourly pay and working hours (Förster and Königs, 2020).
Higher education policy in Austria largely follows an egalitarian approach (Pechar and Pellert, 2004). Anyone who has completed upper secondary education has access to higher education, and there are no tuition fees. Entrance examinations are limited to Universities of Applied Sciences (`Fachhochschulen’) and some fields where demand significantly exceeds supply (e.g. medicine, psychology, teacher training). However, selection in Austria takes place at the secondary level, with the choice between apprenticeships that do not allow access to higher education and academic (`Gymnasium’) and vocational upper secondary tracks. This important junction, which is largely determined by educational choices made at the age of 9-10, has been shown to act as a barrier for children from disadvantaged backgrounds, contributing to low social mobility in Austria (Förster and Königs, 2020). When comparing the level of working hours (see Figure 3), differences between the levels of education are also apparent. Highly educated women work the most, and without childcare, their weekly working hours are, on average, around 32 hours, increasing to just over 35 hours. Mothers with a medium level of education increase their working time by approximately 3 hours (from 28 to 31 hours) as the childcare coverage rate increases from 0 up to 60 per cent.
Educational Expansion
Comparatively, Austria is one of the countries with the lowest levels of tertiary education (see Figure 1 in (Sauer and Van Kerm, 2021). Nevertheless, tracking annual changes shows that education has expanded in Austria.
Figure 1 shows the proportion of women and men aged 30-50 with diploma degrees (i.e. one-cycle degrees, which existed in Austria before the Bologna reform introduced a two-cycle structure in 2000/01), bachelor (BA), master (MA) and doctorate (PhD) degrees. The increase in educational attainment was particularly pronounced for one-cycle degrees in the period 2000-05, when women overtook men. In 2013, as students had to complete the `old’ diploma degrees or otherwise move to the BA or MA level, the trend for men flattened out. For women, the proportion continued to increase from 15% in 2015 to 20% in 2020, which could be due to the fact that teaching degrees in all fields had not fully transitioned to the two-cycle structure until 2020.4 BA and MA degrees can be observed in the data from 2014 onwards. The proportion of BA graduates increased from 1.8 % for both women and men to 6.7 % for women and 5.2 % for men in 2020, while the proportion of MA graduates remained below 1 %. The proportion of PhD graduates is relatively constant at around 1.5 % over time.
Figure 1: Higher education premiums over time 1994-2020
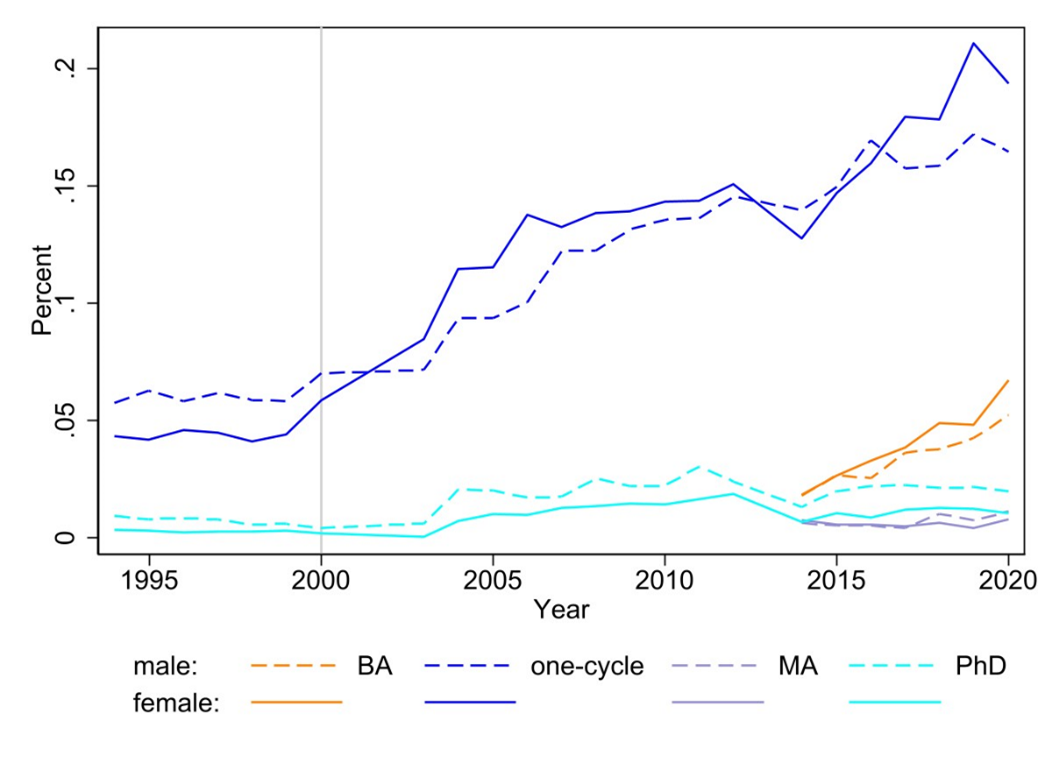
Notes: Own calculations based on LIS data. The education categories are constructed based on the country-specific education variable (educ_c). The vertical line in 2000 marks the implementation of the Bologna structure.
Tracking educational attainment across cohorts (Figure 2) gives a similar but more nuanced picture. Tertiary education began to expand with the cohorts born in 1960. The proportion of women and men aged 30-50 with a one-cycle degree doubled from 9.9 % and 8 % in the 1960 cohort to 19.2 % and 18.9 % in the 1980 cohort. This trend levelled off with the cohorts entering the newly introduced two-cycle structure. Thus, BA degrees became increasingly common, tripling from 3.2 % (males) and 4 % (females) in the 1980 cohort to 9.7 % (males) and 10.1 % (females) in the 1988 cohort.
Figure 2: Educational expansion across birth cohorts
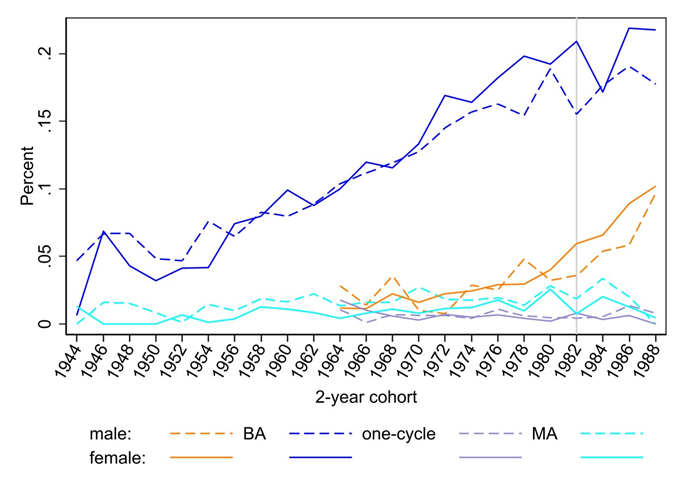
Notes: Own calculations based on LIS data. The education categories are constructed based on the country-specific education variable (educ_c). The cohort born in 1982 was 18 when the Bologna structure was implemented in 2000.
In general, more women than men obtain tertiary education. This has been the case since the beginning of the millennium, and for cohorts born in the 1970s and 1980s. The female advantage is, however, much less pronounced in Austria than in other high-income countries (Sauer and Van Kerm, 2021).
The Higher Education Premium
Figure 3 shows the evolution of the gender-specific premium for tertiary education as obtained from OLS regressions of gross hourly wages on a dummy variable indicating whether a person has completed tertiary education5 , controlling for age, marital and migration status, and hours worked, considering dependent employees aged 30-50. Panel (a) uses the logarithm of gross wages as the dependent variable, thus showing the premium in relative terms. In 1994, tertiary educated workers earned 41.6 % (men) and 34.8 % (women) more than less educated workers. By 2005 the premium had increased to 46.3 % and 66.2 % for men and women respectively, before falling back to 27.7 % and 41.2 % in 2020. This suggests that the incentive to invest in education is greater for women than for men.
Figure 3: Higher education premiums 1994 – 2020
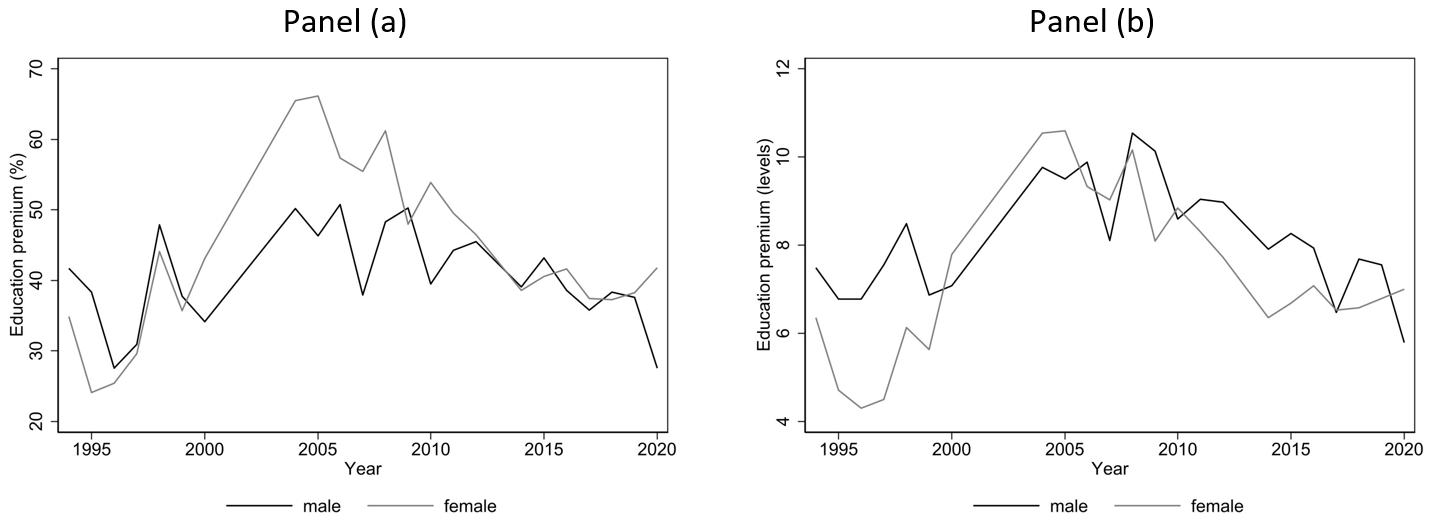
Notes: Own calculations based on LIS data. OLS regressions for each year and gender of the logarithm (panel a) or the level (panel b) on tertiary education (BA, one-cycle, MA or PhD degree) controlling for age, age^2, marital status, migration status and working hours.
As argued by Mandel and Rotman (2021), the relative premium is not well suited to capture differences between groups (and time points) with different distributions. Relative premiums may be larger for women than for men because wages tend to be lower at the bottom. In addition, the logarithm compresses the distribution and makes movements at the top less relevant for the overall dynamics. Panel (b), therefore, shows the higher education premium based on a specification using the level of gross wages (in 2017 USD) as the dependent variable, which shows the premium in absolute terms. Although the overall trend is similar, the gender difference is less pronounced in the 2000-10 period, and since then, the male premium has been slightly higher than the female premium. This is in line with the findings of Mandel and Rotman (2021) for the US and indicates that the fact that top income inequality is more pronounced for men than for women drives the higher education premium.
The datapoints from 2014 and onwards allow for an additional breakdown in more detailed education categories at the tertiary level. However, the small sample sizes do not allow for a distinction between men and women. A few more additional datasets will be needed to strengthen the robust calculation of educational premiums distinguished by sex. Figure 4 shows that a BA degree yields, on average, 20% higher wages than lower levels of education. The premium for the `old’ diploma is more than twice as high (40%), and the monetary return for an MA degree is even higher (60%). It should be noted that this may be due to differences in length and quality or to differences in the signalling value on the labour market.
Figure 4: Education premiums by detailed education category
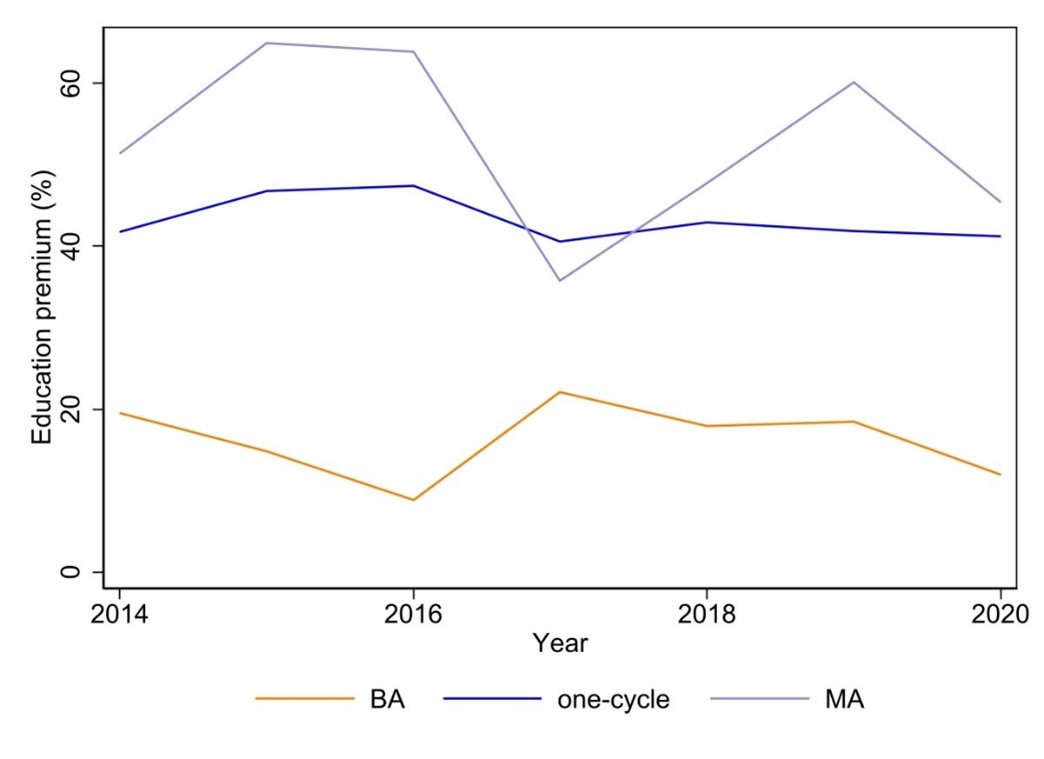
Notes: Own calculations based on LIS data. The education categories are constructed based on the country-specific education variable (educ_c).
Potential explanations and ways forward
Existing comparative evidence from Weisstanner and Armingeon (2018), based on LIS data, shows that Austria is in the upper half of the spectrum of high-income countries, with an average education premium of 40% over the period 2004-14. Other continental European countries such as Germany and Switzerland have similar values; the premium is higher in the US (more than 60%), Spain, Poland and the Czech Republic (around 50%) but much lower in the Nordic countries (around 20%). In about half of the 22 countries analysed by Weisstanner and Armingeon (2018), the premium declined in the period 2007-13.
Various explanations have been put forward to understand cross-country differences and changes over time. For example, the continuously decreasing premium observed in Austria since 2005 could be the outcome of market forces, i.e. the supply of tertiary-educated workers outstripping the demand driven by technological change and globalisation (e.g. Autor et al., 2020). However, institutional factors and policies may also be relevant. Wage-setting mechanisms set floors for lower wages and ceilings for higher wages, thereby limiting the spread between the wages of high- and low-educated workers. Moreover, generous public spending on education and progressive tax-transfer systems have been shown to limit the spread of education premiums by altering incentives to bargain for high wages (Weisstanner and Armingeon, 2020). The extent to which these factors help to explain changes over time, and whether they apply differently to women and men, remains an open question. The availability of country-specific annualised time series facilitates research that addresses such questions. On the one hand, reforms such as the Bologna process could be used to make causal inferences about the impact of educational expansion. On the other hand, policy changes in relevant areas that affect wages in different parts of the distribution can not only shed light on the importance of institutional factors but also help to understand the relative relevance of top versus bottom dynamics and gender differences. While this enables to shed light into the underlying mechanisms of country-specific time trends it has to be acknowledged that such mechanisms differ across contexts (van de Werfhorst, 2011).
1 University of Fribourg, Vienna University of Economics and Business, Luxembourg Income Study (LIS), Luxembourg Institute for Socio-economic Research (LISER)
2 The harmonised data is based on the ECHP from 1994 to 2000 and the SILC from 2003 onwards.
3 These figures are obtained through DART: https://dart.lisdatacenter.org/dart.
4 Medicine, Dentistry, and Veterinary studies will remain exemptions from the Bologna structure.
5 This includes one-cycle, BA, MA and PhD degrees.
Literature
| Autor, D., Goldin, C. and Katz, L. F. (2020) Extending the Race between Education and Technology, Working Paper, National Bureau of Economic Research. |
| Delahaie, N., Vandekerckhove, S. and Vincent, C. (2015) ‘Wages and Collective Bargaining Systems in Europe during the Crisis’. In Wage bargaining under the new European Economic Governance, ETUI, pp. 61–91. |
| Esping-Andersen, G. (1990) The Three Worlds of Welfare Capitalism, Princeton, New Jersey, Princeton University Press. |
| Förster, M. F. and Königs, M. (2020) Promoting Social Mobility in Austria, OECD. |
| Hall, P. A. and Soskice, D. (2001) Varieties of Capitalism, Oxford University Press. |
| Mandel, H. and Rotman, A. (2021) ‘Revealing the Concealed Effect of Top Earnings on the Gender Gap in the Economic Value of Higher Education in the United States, 1980-2017’, Demography, 58, 551–570. |
| Pechar, H. and Pellert, A. (2004) ‘Austrian Universities under Pressure from Bologna’, European Journal of Education, 39, 317–330. |
| Rocha-Akis, S., Bierbaumer-Polly, J., Einsiedl, M., Guger, A., Klien, M., Leoni, T., Lutz, H. and Mayrhuber, C. (2016) Umverteilung durch den Staat in Österreich, WIFO. |
| Sauer, P. and Van Kerm, P. (2021) ‘Higher Education Expansion and Inequality in Labour Incomes: The Importance of a Gendered Perspective’, LIS newsletter. |
| Weisstanner, D. and Armingeon, K. (2018) ‘How Redistributive Policies Reduce Market Inequality: Education Premiums in 22 OECD Countries’, Socio-Economic Review, 0, 1–18. |
| van de Werfhorst, H. G. (2011) ‘Skills, Positional Good or Social Closure? The Role of Education across Structural–Institutional Labour Market Settings’, Journal of Education and Work, 24, 521–548. |