Issue, No.30 (June 2024)
Analyzing the Impact of Social Protection Programs in a Cross-national Perspective – Part 2
This article is based on the author’s presentation “How to compare social protection programs around the world and measure their role in eradicating extreme poverty and vulnerability to poverty” held at the UNECE Group of Experts on Measuring Poverty and Inequality meeting in Geneva, 28-29 November 2023.
1) Introduction
Continuous readers of Inequality Matters may be well aware that a follow-up of the previous article, Analyzing the Impact of Social Protection Programs in a Cross-national Perspective (Issue 29, March 2024), was scheduled for this issue. So, as promised, here it is. Before proceeding with the second part, let me quickly recapture the main argument from the previous article. In the first part, I had introduced a simple technique to analyze the effectiveness of social transfers in poverty prevention. I showcased how the percentage of poor would go up when all social transfers or one area of social transfers were taken out entirely from disposable income. The poverty concept was benchmarked against relative poverty estimation techniques where a certain percentage is considered at-risk-of poverty, when the income is below a certain percentage of median equivalised disposable income. Various alternatives in methodology were discussed and the methodology was further elaborated on a sub-group setting for single-parent households. It had been concluded that when comparing relative at-risk-of-poverty over time, one gets a better idea of how things have changed for vulnerable groups and how policies have made a difference. The time and cross-country dimensions also give also valuable information about policy intervention and the behavioral consequences of persons adapting to these changes in the short- and mid-term. However, at the same time, the methodology fell short of giving a clear indication of poverty trends, i. e., how countries prevent poverty measured against an absolute fixed threshold over time. Therefore, this article will extend the scope to absolute poverty measures and highlight its valuable contribution and discuss its limitations. The article concludes with a summary.
2) Absolute poverty measurement – international poverty lines
Absolute poverty measurement is different from relative measures. Among others, for international comparison a common technique of an international poverty line has been developed in a background paper for the World Bank’s World Development Report 1990. In the initial methodology introduced by Ravallion, Datt, and van de Walle (1991), the poverty line was determined by selecting 33 national poverty lines in various developing and industrialized countries. Using purchasing power parity (PPP) exchange rates, all national poverty lines were converted into US dollars for the base year 1985. From the relative numerical proximity of the poverty lines, a common poverty line was set to 32 US dollars per month, which in the following was described as international poverty line set at one dollar per day. In their paper Dollar a Day Revisited, Ravallion, Chen, and Sangraula (2009) provide an updated analysis and history of the international poverty line concept. The current poverty thresholds are described by Jolliffe et al. (2022). In addition to the commonly used extreme poverty threshold $2.15 based on low-income countries, the authors estimated two alternative measures. The rates for lower-middle-income countries and upper-middle-income countries are calculated to be $3.65 and $6.85, respectively, expressed in 2017 PPP. These are valuable additions, particularly when comparing results across countries with different levels of development.
In the following, I simply use these commonly applied thresholds as a tool to visualize progress over time. Although used typically in conjunction with consumption data, the application to income data allows for additional interpretation concerning the importance of social transfers.
Like in Figure 1 in the previous article, the grey bars in Figure 3 describe the population share with disposable income below the poverty threshold. Unlike in Figure 1, where the relative poverty threshold is re-calculated year by year, in Figure 3 the threshold for poverty is fixed for the entire over-time series at $6.85. Thus, the more progress in a country, the steeper the decrease in poverty. Analogously to Figure 1 the squares show the poverty rates when either all social transfers (blue), or simply one policy area (family transfers (red) or general social assistance (green)) is taken out from disposable income. The methodology is exemplified in a two-country comparison of Poland and the United Kingdom.
Fig. 3. Absolute poverty rates before and after social transfers
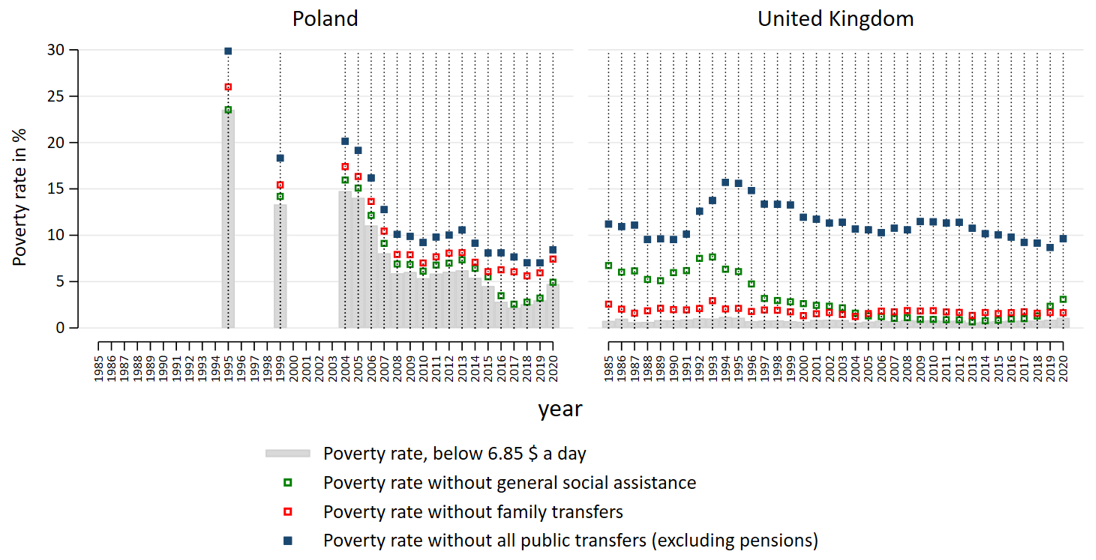
The example of the United Kingdom shows that the threshold for upper-middle income countries is practically too low since the beginning of the series in 1985 to yield a significant share of persons with income below this threshold; these might refer mostly to persons with instable income, e. g. temporary losses through self-employment activity or negative returns from capital on the one hand, but possibly also from incompletely collected information on regular income in the survey responses on the other hand. What is striking to see is that, particularly in the early 1990s, social transfers are a significant pillar of poverty prevention. Note that the rate of 15 % excludes entirely the effect of pensions. Thus, for roughly 15 % of the population, social transfers (without taking pensions into account) are the essential source to be out of poverty, measured at the threshold of $6.85 for upper-middle income countries, which is set for a high-income country like the United Kingdom at a relatively extremely low level. Raising the threshold would, therefore, show even distinctly higher rates. Interestingly enough, taking out solely transfers from one policy area, as shown here each separately for family transfers and general social assistance, hardly has an impact on increased poverty. This indicates that in the United Kingdom various social transfers from different policy areas are received simultaneously.1
The case of Poland reveals an entirely different pattern. First of all, the threshold of $6.85 for upper-middle-income countries was still a decisive threshold for 15 % of the population in the mid-2000s. The steeply decreasing poverty rates since then mirror the quick progress moving from entering the upper-middle income group to entering the high-income group within 15 years (World Bank Group, 2017). The effect of taking out social transfers is less pronounced as compared to the United Kingdom. This mirrors a comparatively less established social security system. Moreover, starting from 2016, the main effect of poverty prevention can be allocated to family transfers. As argued in the previous article, the transition from assistance-based to universal child allowance is the primary explanation for this pattern. An interesting insight is that poverty rates started to go up in 2019, mirroring one important effect: other incomes besides family transfers may have become less important in the income mix; in other words, some households rely less on additional income sources. Given Poland’s rather good economic situation, this seems to be a behavioral consequence rather than an economically driven one. Additional socio-demographic information on the subsample falling below the threshold would be essential to get further insight into who is among the 5 % of the population below the threshold or among the 7.5 %, respectively, when taking out family transfers.
Figure 4 provides an extended overview of the various absolute poverty thresholds established by the World Bank Group: $2.15, $3.65, and $6.85. Panel A shows the long-term trends in four countries which experience a transformation from upper-middle to high-income countries in this period. According to the current World Bank classification, Chile and Romania are already considered high-income countries, whereas Mexico and Paraguay are still among the upper-middle-income group. Panel B shows, besides the previously introduced case of the United Kingdom, two more advanced high-income countries, France and the United States.
Fig. 4. Absolute poverty trends around the world
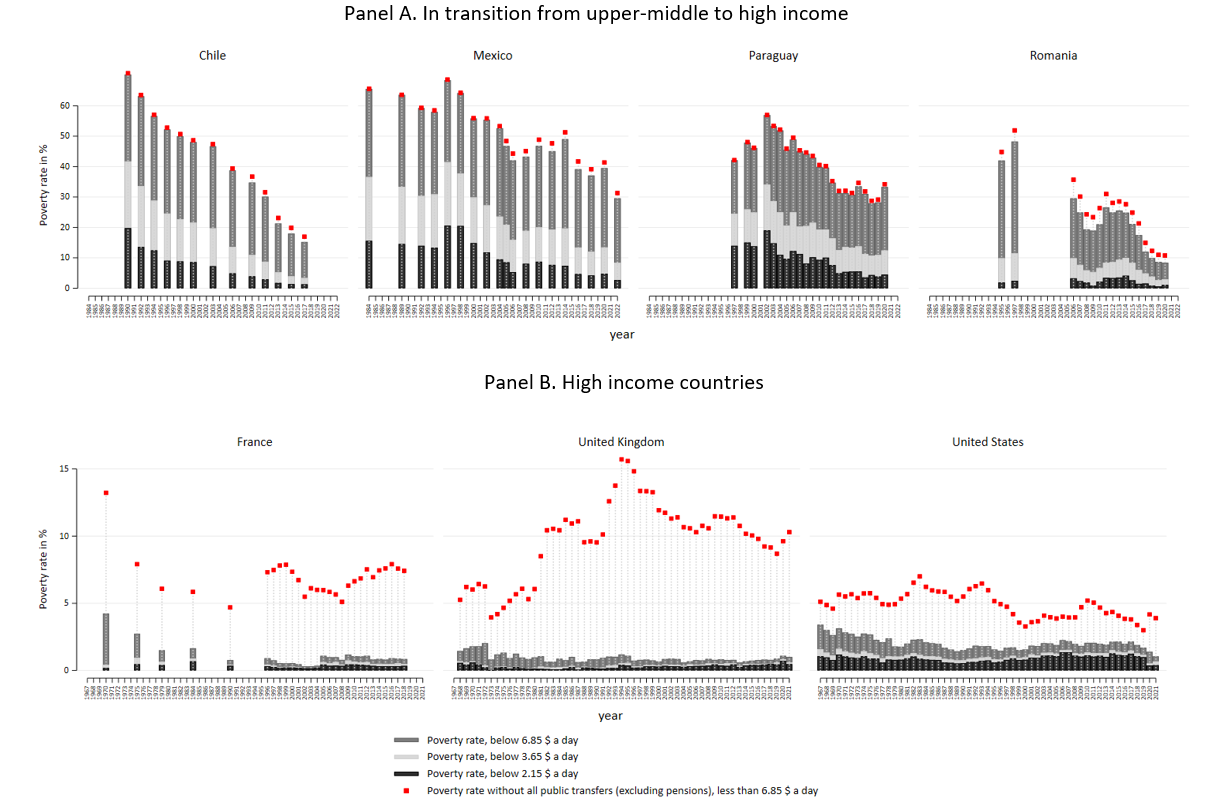
The comparison between the two panels reveals a striking difference in the importance of social transfers. Taking out social transfers from disposable income does not strongly increase poverty rates in panel A. To a certain extent the only exception is Romania, which is somewhat similar to the Polish case analyzed before. In both countries, taking out social transfers increases absolute poverty by roughly four percentage points. This is much less compared to the cases of France (on average around seven percentage points increase) and the United Kingdom (on average around ten percentage points increase). Notable is the distinctive pattern in the United States, where a larger share of persons remains below the poverty thresholds, even the $2.15 threshold. At the same time, the United States looks less dependable on current social transfers; poverty rates after taking out social transfers yield poverty rates mostly still below 5 %. The impact of the COVID-19 measures in 2020 and 2021 is interesting, which helped to decrease the population share living below the various poverty thresholds substantially. An interactive tool where the absolute poverty threshold could be raised, based on the user’s interest, would be perfect.
There are a few shortcomings to be noted. First of all, the presented thresholds are arbitrarily chosen. The income level of $6.85 might, in one country, capture the level to cover a typical basket of goods for essential consumption well. In contrast, in another country, the level might be just too high (overestimation of poverty, as the basket of goods for essential consumption is much cheaper) or too low (underestimation of poverty, as the basket of goods for essential consumption is much more expensive). An internationally agreed definition of a basket of essential goods is hard to achieve, as this is at the discretion of the national institutes. Even, if possible, this would mean that national concepts for absolute poverty thresholds need to differ ideally across countries and over time. Whether such an approach could yield comparable outcomes remains questionable. The here presented concept of an international poverty line should be understood as a welcome simplification that allows easy country comparisons over time.
Another limitation concerns the spatial differences in price levels within countries. Similar income levels do not allow to consume the same basket of goods across regions. This is a well-established element in consumption data analyses at the national level but much less common in income data analyses. By using one commonly defined poverty threshold over the entire country, one certainly loses precision in determining who is actually poor. Therefore, an analysis based on consumption data in conjunction with income and social security data would yield better insights. Unfortunately, such data are frequently not collected jointly in advanced countries.
3) Conclusion – one indicator is not enough – reflections on a helpful visualization tool
In conclusion, social protection systems play a crucial role in helping people escape poverty. It is essential to look at both social benefits and poverty levels together. Both articles together have shown that absolute and relative poverty measures give different but important information. But the key lesson is: One indicator is not enough. It is the multitude of information and options that allow for multifaceted analyses and recommendations to further develop well-targeted social security systems.
To understand all of this, interactive visualization tools are crucial. Such tools need to be easy to understand and, at the same time, allow for modifying multiple factors. Among these critical factors are choosing specific benefits, looking at different groups of people, deciding on the method for measuring poverty, and selecting a time frame. In addition, there is also a need for exhaustive metadata, including clear correspondence between national programs, which are included in the broader policy areas each year. Although this information exists in the LIS Database, retrieving it in a cross-country setting and over time is challenging but worth an attempt given its merits for evidence-based policy decisions.
1 This is supported by the equally low importance of the other policy areas not shown here. A complete set of numbers can be forwarded upon request for the curious reader.
References
| Ravallion, M.; Datt, G.; Walle, D. (1991). Quantifying absolute poverty in the developing world, Review of Income and Wealth, 37(4), 345–361, https://doi.org/10.1111/j.1475-4991.1991.tb00378.x |
| Ravallion, M.; Chen, S.; Sangraula, P. (2009). Dollar a Day Revisited, The World Bank Economic Review, Volume 23, Issue 2, 2009, 163–184, https://doi.org/10.1093/wber/lhp007. |
| Jolliffe, D.; Gerszon Mahler, D.; Lakner, C.; Atamanov, A, Kofi Tetteh-Baah, S. (2022). Assessing the Impact of the 2017 PPPs on the International Poverty Line and Global Poverty. Policy Research Working Paper 9941, The World Bank. |
| World Bank Group (2017). Lessons from Poland, Insights for Poland: A Sustainable and Inclusive Transition to High Income Status. World Bank, Washington, DC, http://hdl.handle.net/10986/28960. |