Issue, No.32 (December 2024)
Bringing Our World in Data’s Visualization Tools to the Luxembourg Income Study
Our World in Data is an online scientific publication that focuses on global problems such as poverty, disease, hunger, climate change, war, and inequality. We empower policymakers, journalists, educators, campaigners, and the public by making data and research on these issues accessible and understandable.
At the heart of our work is data visualization. We design and build interactive tools that allow people to explore a wide range of indicators sourced from leading data providers and research organizations.
Data from the Luxembourg Income Study has long been featured on our website, given the crucial comparative perspective it offers on incomes across the distribution. More recently, we have been able to give something back by providing data visualization tools that are now embedded within the LIS website itself.
There are now three Our World in Data Data Explorers available via the ‘Data Access’ section of the LIS website: www.lisdatacenter.org/data-access:
- Poverty (www.lisdatacenter.org/data-access/lis-in-our-world-in-data-owid/lis-in-our-world-in-data-poverty)
- Inequality (www.lisdatacenter.org/data-access/lis-in-our-world-in-data-owid/lis-in-our-world-in-data-inequality)
- Incomes across the distribution (https://www.lisdatacenter.org/data-access/lis-in-our-world-in-data-owid/lis-in-our-world-in-data-incomes-across-the-distribution)
In each case, these provide users a quick way to navigate the most important summary indicators, calculated from LIS microdata and consistent with the definitions and methods adopted in the LIS Key Figures and DART data dashboard.
Our visualization tools
Key features of our Data Explorers include:
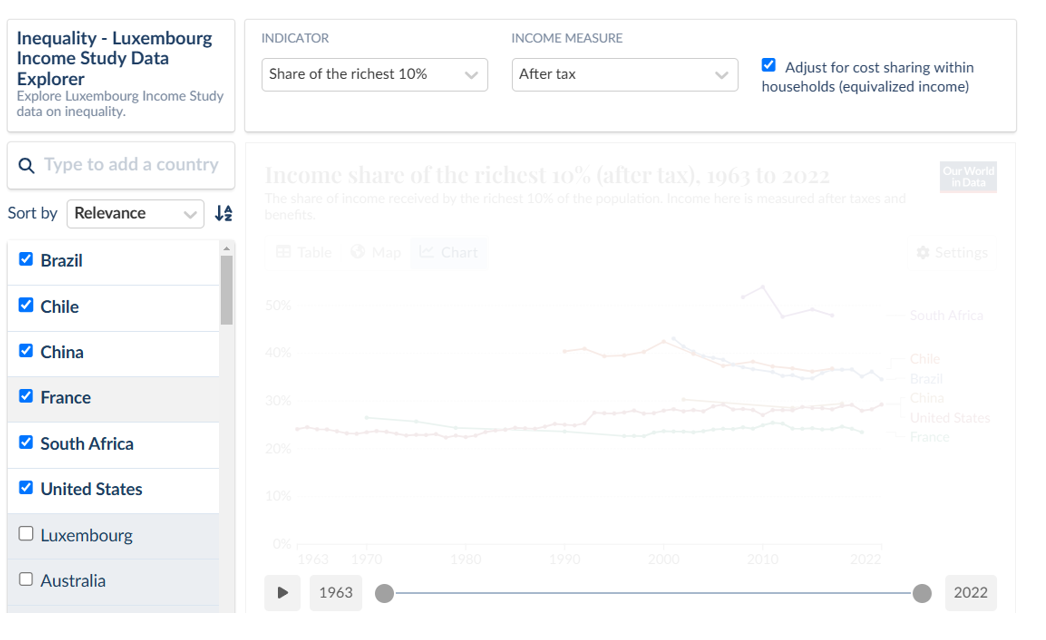
- Controls to switch between related measures and select countries and periods (fig. 1)
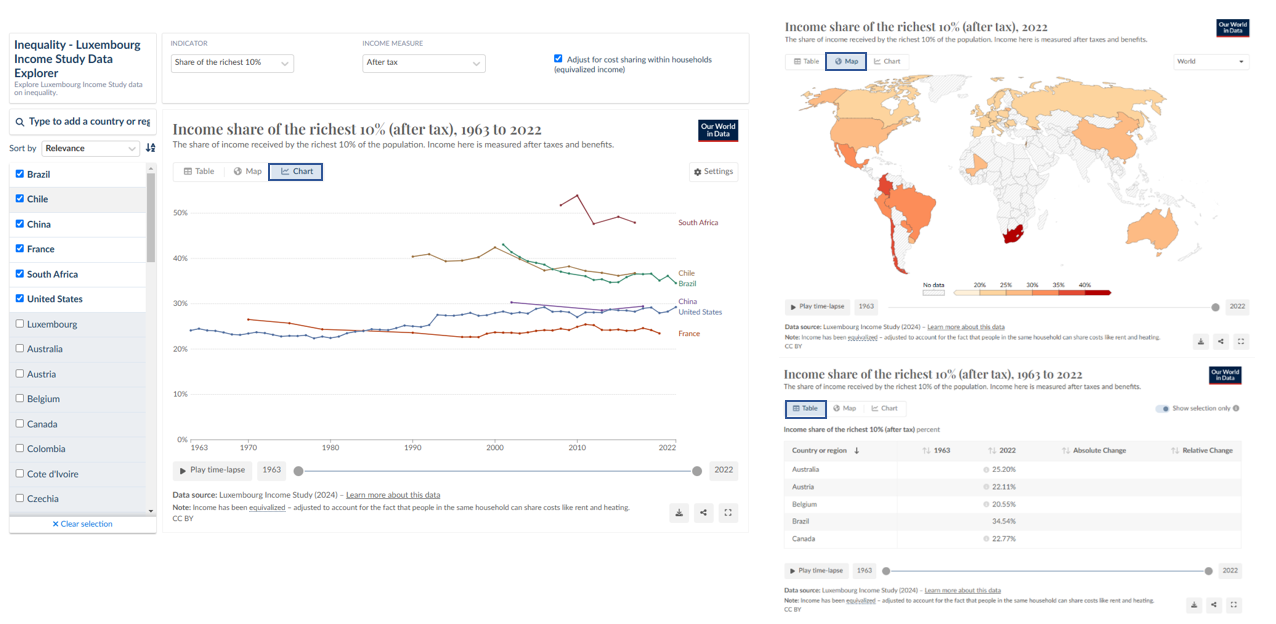
- Line chart, map, and table views of the data (fig. 2)
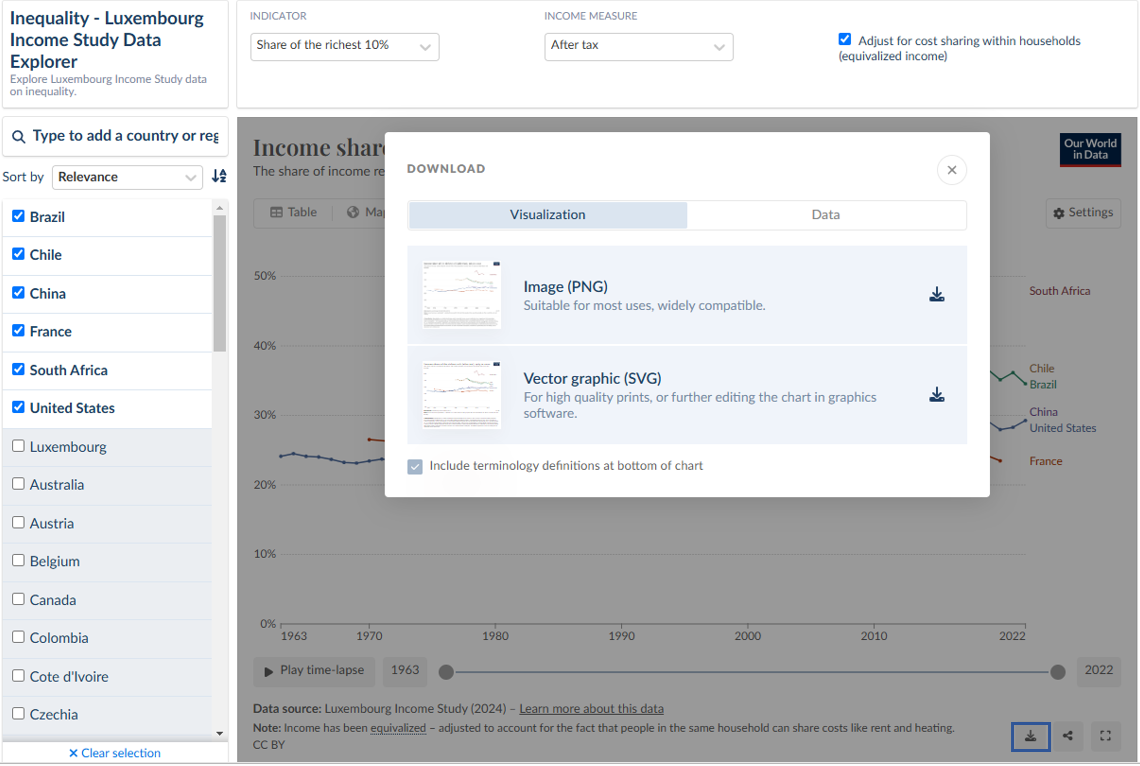
- Quick downloads of both the data and chart image files (fig. 3)
Fig. 1. Controls to switch between related measures and select countries and periods

Fig. 2. Line chart, map, and table views of the data

Fig. 3. Quick downloads of both the data and chart image files

Indicators
The international harmonized microdata prepared by the Luxembourg Income Study offers researchers a unique resource. Through a remote execution system (LISSY) it allows researchers from all over the world to analyse and compare in detail household income and wealth and its components, factoring in household composition, socio-demographic characteristics, and employment status.
To extend its audience, LIS provides a range of summary indicators through the LIS Key Figures and the DART data dashboard. The Our World in Data Explorers add to these efforts but with a more generalist audience in mind. We have prioritized more concrete, intuitive metrics (e.g., average income by decile) over some of the more abstract metrics used in research (e.g., Atkinson index). We simplify the range of options by only including measures for the total population, leaving out sub-group breakdowns. The titles and notes annotating the charts try to avoid technical jargon wherever possible without sacrificing accuracy.
The three Data Explorers include the following indicators:
- Poverty :
- Inequality:
■ Gini coefficient
■ Top 10% share of income
■ Bottom 50% share of income
■ Palma ratio
■ Share in relative poverty (defined here as incomes below 50% of the median) - Incomes across the distribution:
■ Mean and median income across the whole population
■ Mean and share of income received by each decile
■ Decile thresholds (P10, P20… P90)
■ Number and share of people in poverty (using a range of absolute and relative poverty lines)
■ Shortfall of incomes from the poverty line (summed across the whole population in poverty, and on average)
■ Poverty gap (the share of the population in poverty multiplied by the average shortfall from the poverty line, expressed as a percentage of the poverty line)
Welfare measure
For each indicator, figures can be viewed for both before- and after-tax income, using the welfare aggregates adopted within the LIS Key Figures and DART (www.lisdatacenter.org/data-access/dart/methodology).
As a measure of after-tax income, we use the LIS measure of ‘disposable household income’. This refers to “cash and non-cash income from labor, income from capital, income from pensions (including private and public pensions) and non-pension public social benefits stemming from insurance, universal or assistance schemes (including in-kind social assistance transfers), as well as cash and non-cash private transfers, after deduction of the amount of income taxes and social contributions paid”.
As a measure of before-tax income, we use the LIS measure of ‘market income’. This refers to “income received by the households before public redistribution takes place; it includes cash and non-cash income from labor, income from capital, income from private pensions, as well as cash and non-cash private transfers, before deduction of income taxes and social contributions paid”.
Before-tax (‘market’) income is calculated as the sum of income from labor and capital (LIS variable: ‘hifactor’), private cash transfers and in-kind goods and services provided (‘hiprivate’), and private pensions (‘hi33’). The before-tax income is only calculated for surveys in which the required data on tax and contributions are fully captured (including where it has been imputed).
In order to make absolute comparisons of standards of living across countries and over time, the data — measured in local currencies at current prices — is converted into constant international dollars. The LIS data shown in the Explorers is all currently measured in 2017 international dollars.
Within research on household incomes, it is standard practice to equivalize incomes to help compare welfare across households of different sizes and compositions. Equivalence scales try to take into account economies of scale in consumption and, in some cases, the different needs of children and adults. At the same time, by weakening the link to the more familiar numbers seen on one’s paycheck, equivalization can make it harder for users to orient themselves in the data based on personal experience. While measures may gain in terms of validity, there is some loss in interpretability.
To address this dilemma, our explorers provide the option of switching between two adjustments for household size.
The first option uses a ‘square root’ equivalence scale: each household member (both adults and children) is attributed an income equal to the total household income divided by the square root of the number of household members. This is the same scale as applied in the LIS Key Figures and DART dashboard, ensuring alignment with the summary indicators they contain.
The Data Explorers then allow the option to ‘opt out’ of equivalization and instead use per capita values – total household income divided by the number of members, without any adjustment to account for economies of scale in household consumption. This has the additional benefit of making it easier to compare figures with other data providers, including the World Bank’s Poverty and Inequality Platform.
Built for re-use
While our visualization tools are designed for a generalist audience, we hope they will also benefit the LIS research community.
Our Data Explorers provide quick access to a wide range of indicators drawn from the LIS data. In addition to being viewed in situ, these can be downloaded at the click of a button for further analysis in your own statistical software.
After selecting the metric, countries, and period, the chart image can be downloaded and either directly included in lecture slides, teaching materials, social media, etc., or further adapted using image editing software.
When reusing this work, please remember to cite the Luxembourg Income Study as the original source of the data.
Gaining from collaboration
An important and very old idea in economics is that the division of labour between workers specializing in different tasks can increase their collective productivity.
It is perhaps surprising then to see how limited a degree of specialization there often is within the production of research, including within the field of economics. Individual researchers are often responsible for the whole ‘production line’ from beginning to end: understanding the literature, finding and handling the data, conducting analyses and building models, writing papers, and making tables and figures.
Our Data Explorers aim to support researchers with some of these steps, making it quicker to access and browse the data and to produce clear, readable figures.
Likewise, having long been users of LIS data, we hope that LIS itself will benefit from this collaboration. In developing these visualization tools, our goal has been to add value to LIS data while allowing the LIS team to focus on the unique and crucial contribution they make to the study of poverty and inequality through the provision of harmonized microdata.
More about Our World in Data
Our World in Data is produced as a collaborative effort between researchers at the University of Oxford, who are the scientific contributors of the website content; and the non-profit organization Global Change Data Lab, who owns, publishes and maintains the website and the data tools.
At the University of Oxford, the research team is affiliated with the Oxford Martin Programme on Global Development, where the mission is to produce academic research on the world’s largest problems based on the empirical analysis of global data.
Find more at www.ourworldindata.org/about.
